Guide
What is a ride data overlay?
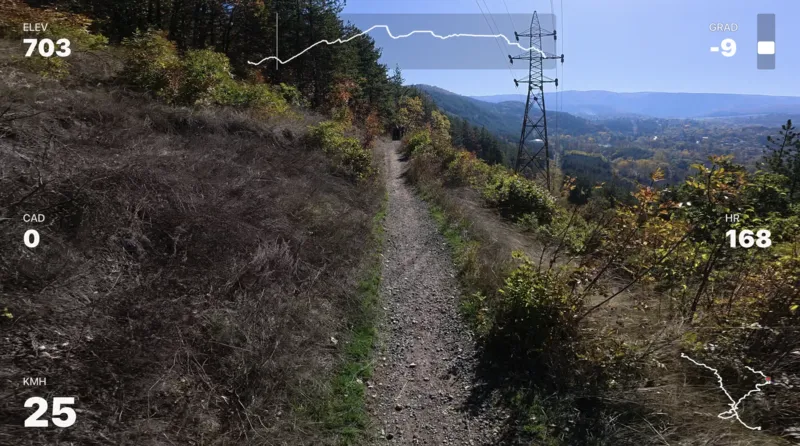
A ride data overlay adds key stats on top of your activity video so the context is clear at a glance. It keeps the footage readable without clutter.
What it shows
Most overlays focus on a few stats. You can keep it light or add detail when it helps the story.
Speed
Speed is the cycling default, with pace as a simple alternative.
Distance and time
How far and how long, without extra noise.
Elevation and gradient
Climb and slope when the terrain matters.
Heart rate or power
Effort signals when you want a deeper view.
Why people use it
The overlay adds clarity without stealing attention from the ride.
Clear context
Viewers know what the activity felt like without guessing.
Better storytelling
The data keeps the narrative grounded in real moments.
Ready to share
The video feels complete with minimal editing.
Works across sports
The same idea works for cycling and running. Cycling visuals are live today, with running support planned. The overlays keep the focus on the story, not the gear.
Supported sports
Road cycling and mountain biking are supported now. Running and trail running are planned as we expand the same clean overlay language.
How a ride data overlay is created
It is a simple blend of ride data and footage, aligned so the stats stay readable without covering the action.
Ride file
A ride file provides timing and context. It can come from Strava or GPX.
Footage
Footage provides the visuals. It is the activity itself.
Overlay
The overlay aligns key moments so stats stay readable and out of the way.
Ride data overlay and other labels
Some people call it telemetry, HUD, or OSD. We call it ride data - the key stats that help your video tell the story.
Quick questions
Short answers, plain language
Focused explanations without product details.
What is a ride data overlay? +
Is it the same as other labels? +
What stats are usually shown - and what should be left out? +
When should an overlay be full vs minimal? +
Will the overlay cover the video? +
Waitlist
Get early access to Movaro.
Join the list to try the first release. We will email when your spot is ready.